



In today’s guest post, it’s my great pleasure to welcome Yago Garitaonaindia and Marco Donia. The power of reconstructed datasets from published curves cannot be overstated. In a series of three peer-reviewed 2026 publications, they demonstrate the clinical and research relevance of such methods. If not already, you should follow them closely! (+ on social media Yago and Marco). Enjoy the post! Timothée
Do not make cross-trial comparisons… Or maybe do?
As medical students and repeatedly thereafter, we are taught not to make comparisons across separate clinical trials.
Yet almost every discussion at ASCO or ESMO eventually includes some variation of the same sentence: “We should not make cross-trial comparisons, but…” and what follows is usually a comparison of two medians, thinking that the elegant disclaimer somehow neutralised its inherent bias.
The reconstruction method, developed by Guyot and colleagues, allows to refine this approach. By extracting the published Kaplan–Meier coordinates and combining them with the reported numbers at risk, we can reconstruct a plausible set of pseudo individual patient data (pseudo-IPD) that closely reproduces the aggregate survival trajectories in the trial.
With such datasets, we can now “cross-trial” compare complete survival distributions, restricted mean survival times (RMST), landmark outcomes, or model-derived hazard ratios rather than simply placing two medians side by side.
Here we discuss some examples of – in our opinion - useful applications of the Kaplan-Meier reconstruction, including granular cross-trial comparisons generating meaningful evidence.
In patients who benefit, what happens next?
As immune checkpoint inhibitors (ICI) approvals have expanded, the proportion of patients eligible for these drugs has increased substantially (Haslam et al. 2025). The proportion estimated to respond has also increased, but far less dramatically. Reconstructed datasets, beyond treatment allocation, event or censoring times, don’t provide information about patients’ other characteristics. As such, reconstruction cannot explain why most treated patients do not respond.
In contrast, by allowing one to explore different time-period within a dataset, reconstructed data-sets can address a complementary and surprisingly neglected question: What happens later to the patients who benefited initially?
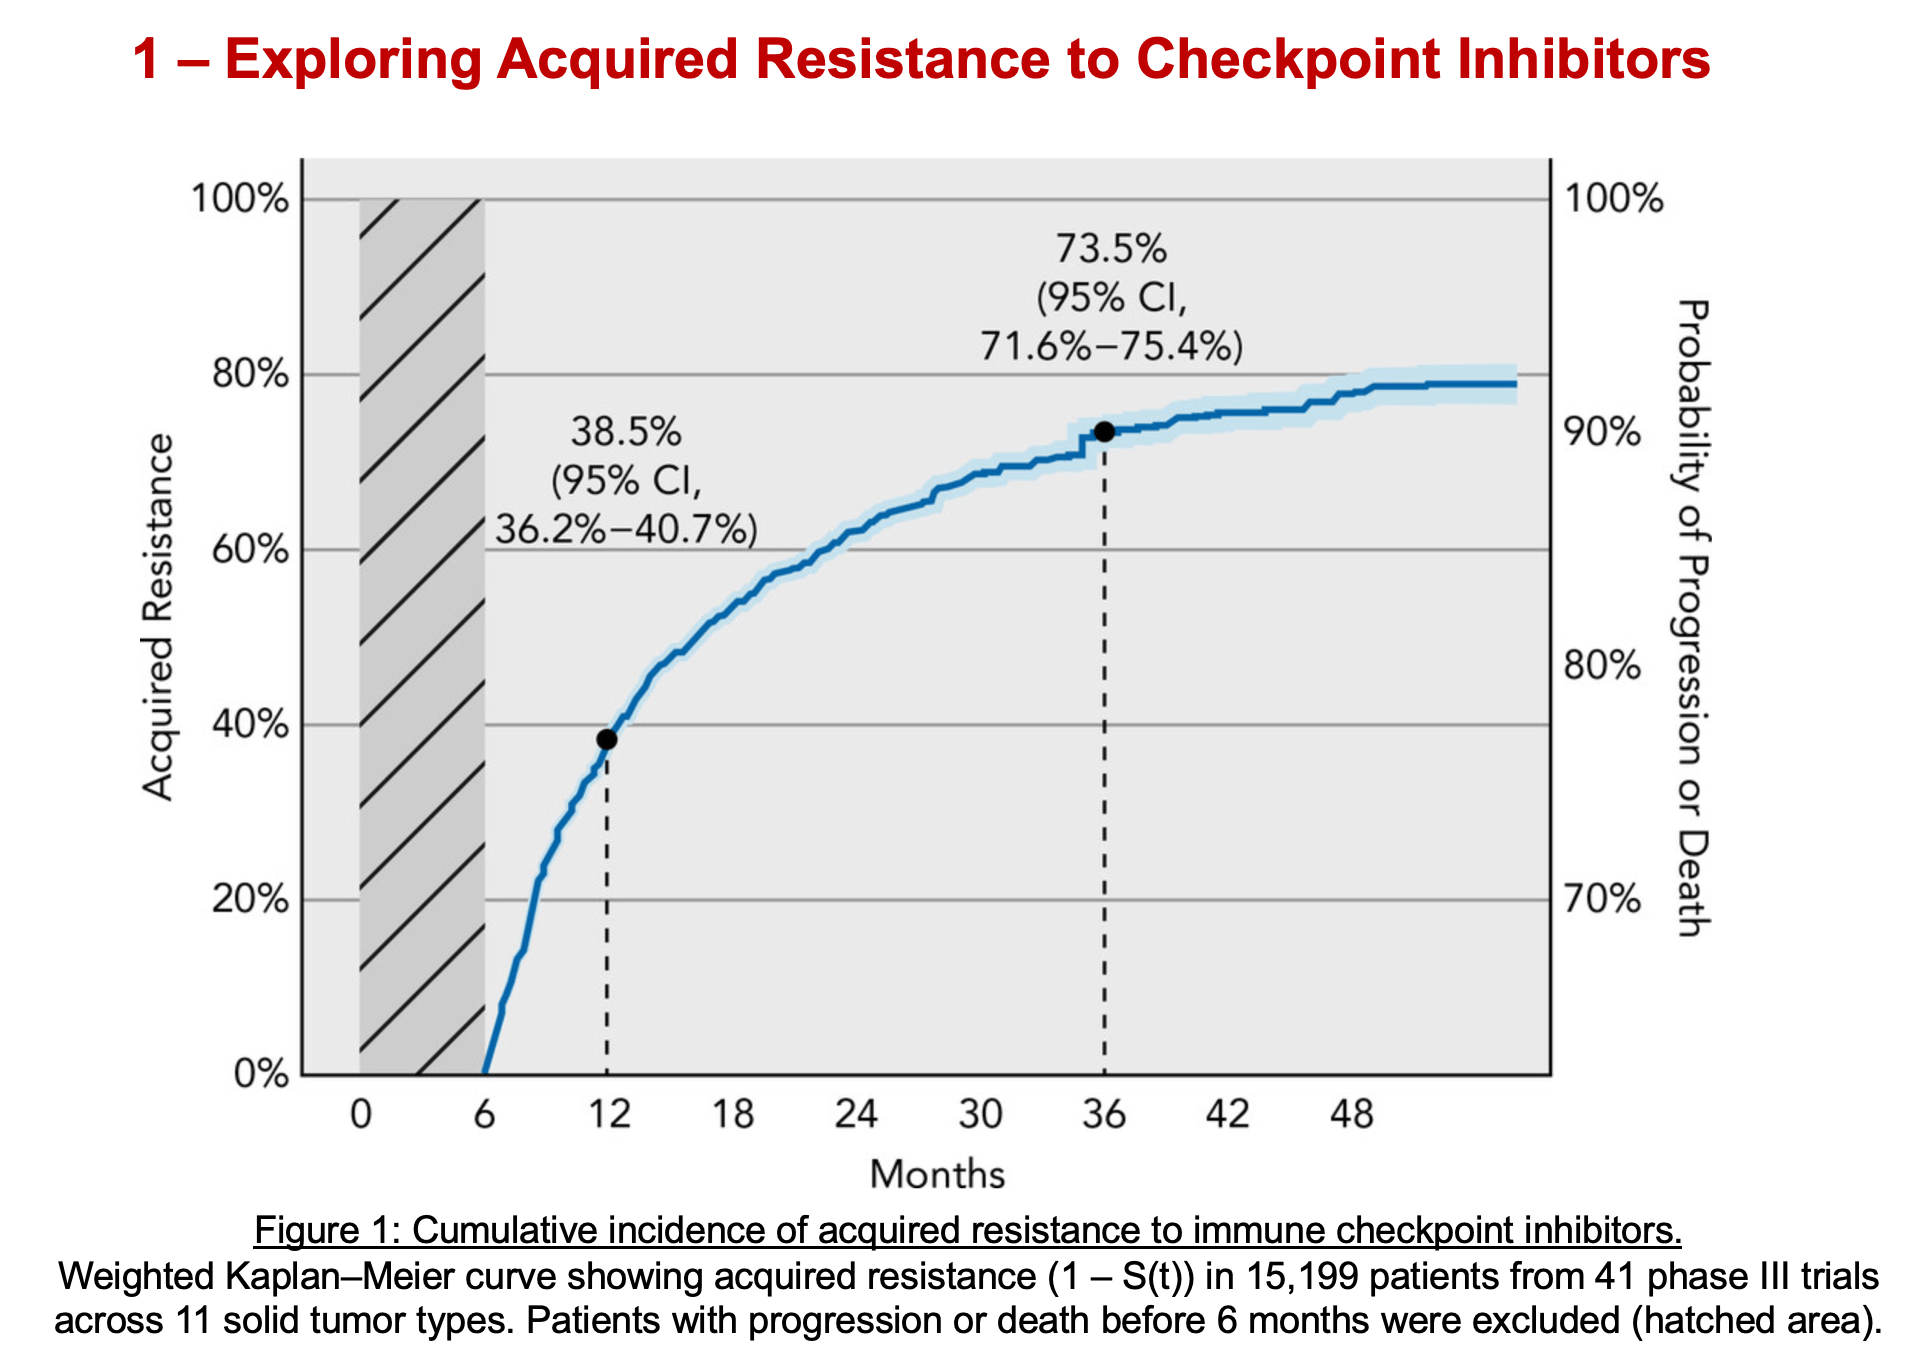
In a work recently published in Journal of the National Comprehensive Cancer Network (JNCCN), we wanted to explore what happen to patients with acquired resistance after immune checkpoint blockade. Even though a uniform definition is lacking, acquired resistance is broadly defined as disease progression after an initial clinical benefit.
In our work, we isolated, in reconstructed datasets, the group of patients who have demonstrated an initial benefit over the first 6-months landmark, and examine their subsequent trajectory.
We estimated that incidence of acquired resistance was 73.5% at three years. In other words, approximately three quarters were no longer progression-free by that time despite having demonstrated sustained initial benefit. This first descriptive result, given the widespread use of immunotherapy, highlights that acquired resistance represent a major global clinical burden.
We wanted to go deeper: our analysis also suggested that the risk of acquired resistance was surprisingly not dependent on tumour histology, but rather on response depth.
We sought to confirm this in a large nationwide study involving patients with melanoma, NSCLC and renal cell carcinoma who had achieved an objective response. In this work, published in 2026 in the European Journal of Cancer (openly available here), we found that outcomes were strikingly similar across tumour types once patients were grouped according to response category: partial response or complete response.
First conclusion: reconstructing curves allowed us to estimate the burden of acquired resistance, which is massive. Then it suggested that the risk of acquired resistance is likely to be tumor-agnostic, and strongly associated with the depth of response, a finding we could replicate in the real-world.
Exploring biological subgroups across trials
A second potential role of reconstructed data is pooled subgroup analysis. When curves are reported by PD-L1 expression, mutation status, disease stage or radiological response, reconstructed datasets then allow to pool these estimates across trials.
Pathological complete response (pCR) offers a particularly informative example. Patients achieving pCR have received (neo-adjuvant) treatment, undergone surgery and been found to have no viable residual tumour on pathological examination. Again, this does not remove differences in stage, regimen, surgery, tumour biology or subsequent therapy. Moreover, because pCR is a post-treatment variable influenced by both treatment and underlying prognosis, conditioning on it introduces its own selection considerations.
Nevertheless, pCR defines a clinically homogeneous post-treatment state, compared to other analyses based exclusively on a single mutation or baseline biomarker.
In a work just published in the Journal of the National Cancer Institute, we reconstructed survival outcomes among patients achieving pCR after neoadjuvant or perioperative immunotherapy-based treatment.
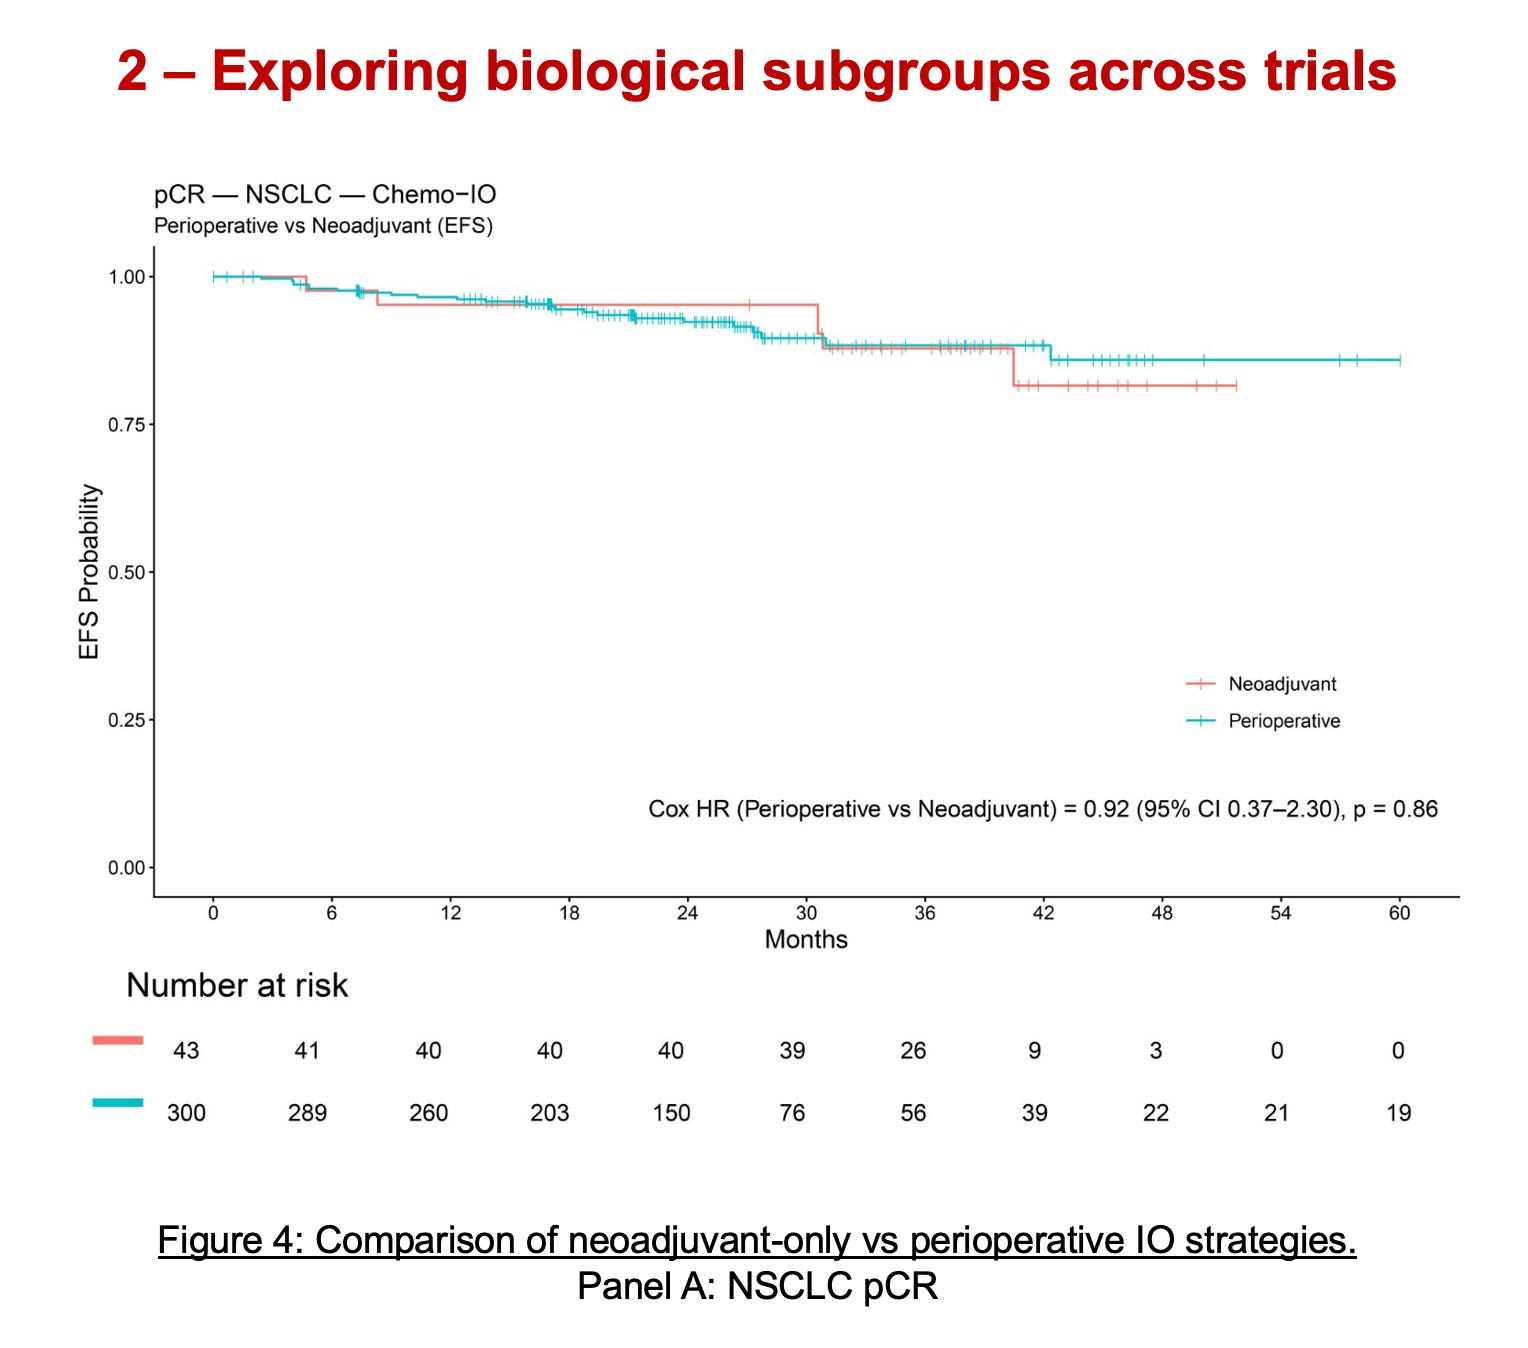
Where comparisons between neoadjuvant-only and perioperative were feasible, postoperative immunotherapy was not associated with a clear improvement in event-free survival among patients who had already achieved pCR. This analysis provides a signal that the routine administration of additional therapy in all patients with pCR deserves prospective testing rather than automatic acceptance.
From trial “efficacy” to delivered “effectiveness”: benchmarking the gap
A third utilisation of reconstructed data is to describe and quantify what is called the efficacy-effectiveness gap.
Pivotal oncology trials frequently exclude substantial proportions of the patients who will ultimately receive the treatment after approval. However, real-world studies have shown that in less selected populations, the observed outcomes (which is now called “effectiveness”) are less pronounced, or can even no longer be present.
Comparing reconstructed data with real-world data “without any matching” provides an highly clinically relevant information : “How far do the outcomes delivered in routine practice deviate from the outcomes that justified approval and reimbursement?”
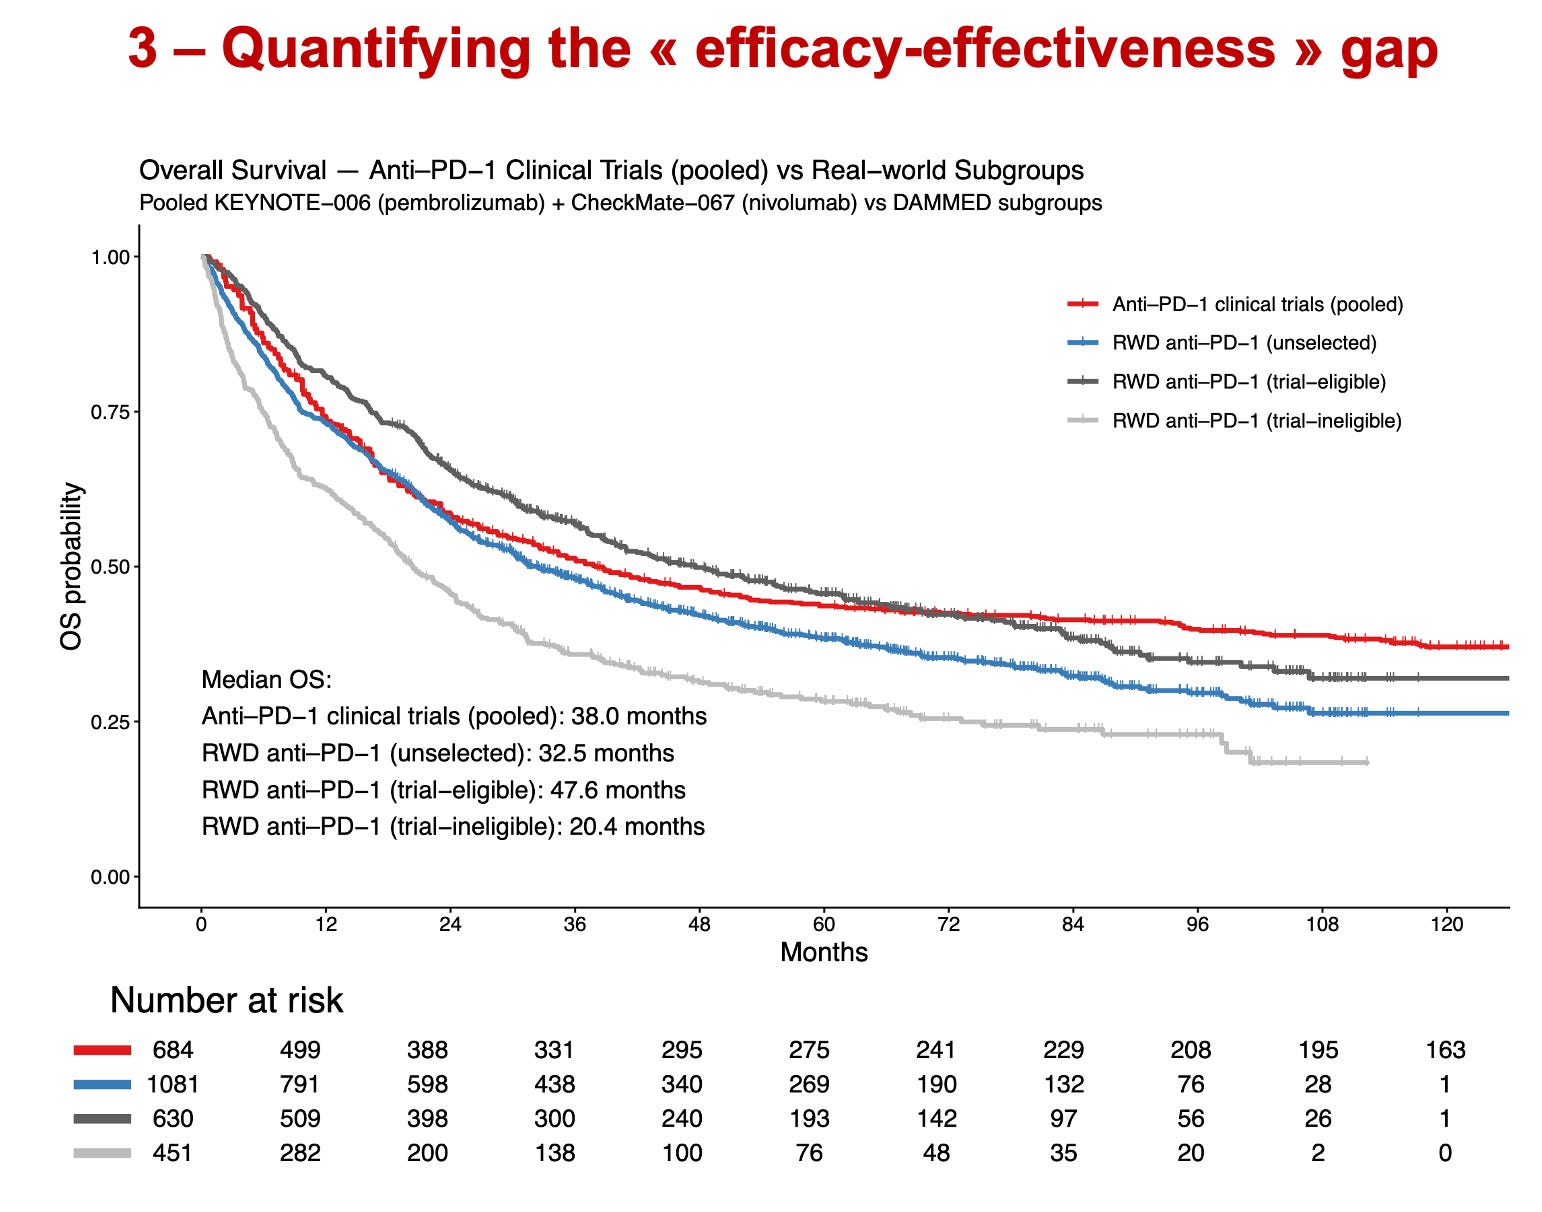
We addressed this question in metastatic melanoma by comparing reconstructed data from pivotal trials with individual-level data from a nationwide clinical registry. Our work has just been published, and is available here. We examined the real-world population both as a whole, and after applying the main pivotal-trial eligibility criteria. The results showed that the efficacy–effectiveness gap was not uniform across treatments.
1 → For anti-PD-1 monotherapy, real-world patients who met the major trial eligibility criteria had outcomes broadly aligned with the pivotal-trial benchmark. The deviation was concentrated predominantly among trial-ineligible patients.
2 → For BRAF/MEK inhibition, however, the gap was larger and remained evident even among patients who were formally trial-eligible. Eligibility alone could not explain the divergence. In this case, we believe a likely contributor was confounding by indication, because the population selected to receive this combination therapy in routine practice was possibly shaped by various factors, including the availability and positioning of competing treatments. Even though these patients might formally meet the eligibility criteria of the pivotal trial, they still differ materially from the trial population.
Reconstruction should not be a substitute for data sharing
These three examples illustrate various uses of reconstruction that extend beyond conventional cross-trial treatment comparisons:
A temporal landmark can recover the subsequent trajectory of patients who have already benefited from therapy.
A post-treatment state such as pCR can define a clinically coherent population in which residual risk and the potential contribution of further treatment can be explored.
Reconstructed data allowed to granularly describe the efficacy-effectiveness gap, which may have broad application for patients and societies.
What can already be achieved by extracting data from published curves illustrates how much more could be accomplished with access to the underlying patient-level data.
Responsible data sharing would allow to ask more refined questions, obtain more precise answers, and identify unmet needs and emerging problems earlier. This would also benefit industry as a whole, by improving evidence generation and informing future drug development, but its greatest value would be for patients, both those treated today and those who participated in the original trials.
Patients entered those trials with the understanding that their contribution would help advance science. Honouring that commitment requires that the data generated become more timely and broadly accessible for responsible independent research under appropriate governance.
Kaplan–Meier curves are not merely images; they are data that we have learned to unlock. We believe these should not be the only trial data independent researchers should be able to access when primary results of major clinical trials are published.

