

The Iceberg Plot: A Visual I Conceived to Differentiate Tumor Biology from Treatment Effect.
I would like to emphasize a plot we published together with Vinay Prasad and Mark Lythgoe.

In non-randomized settings, when there is only one cohort of patients, a common challenge is assessing the benefit of a drug in the absence of a direct comparator.
In such cases, a classic situation is when the disease remains stable for a long period of time before progressing. In those situations, it remains difficult to know whether this apparently positive outcome is occurring simply because the patients were highly selected—with spontaneously slow-growing tumours and indolent biology—or whether the outcome is actually related to the therapy under examination.
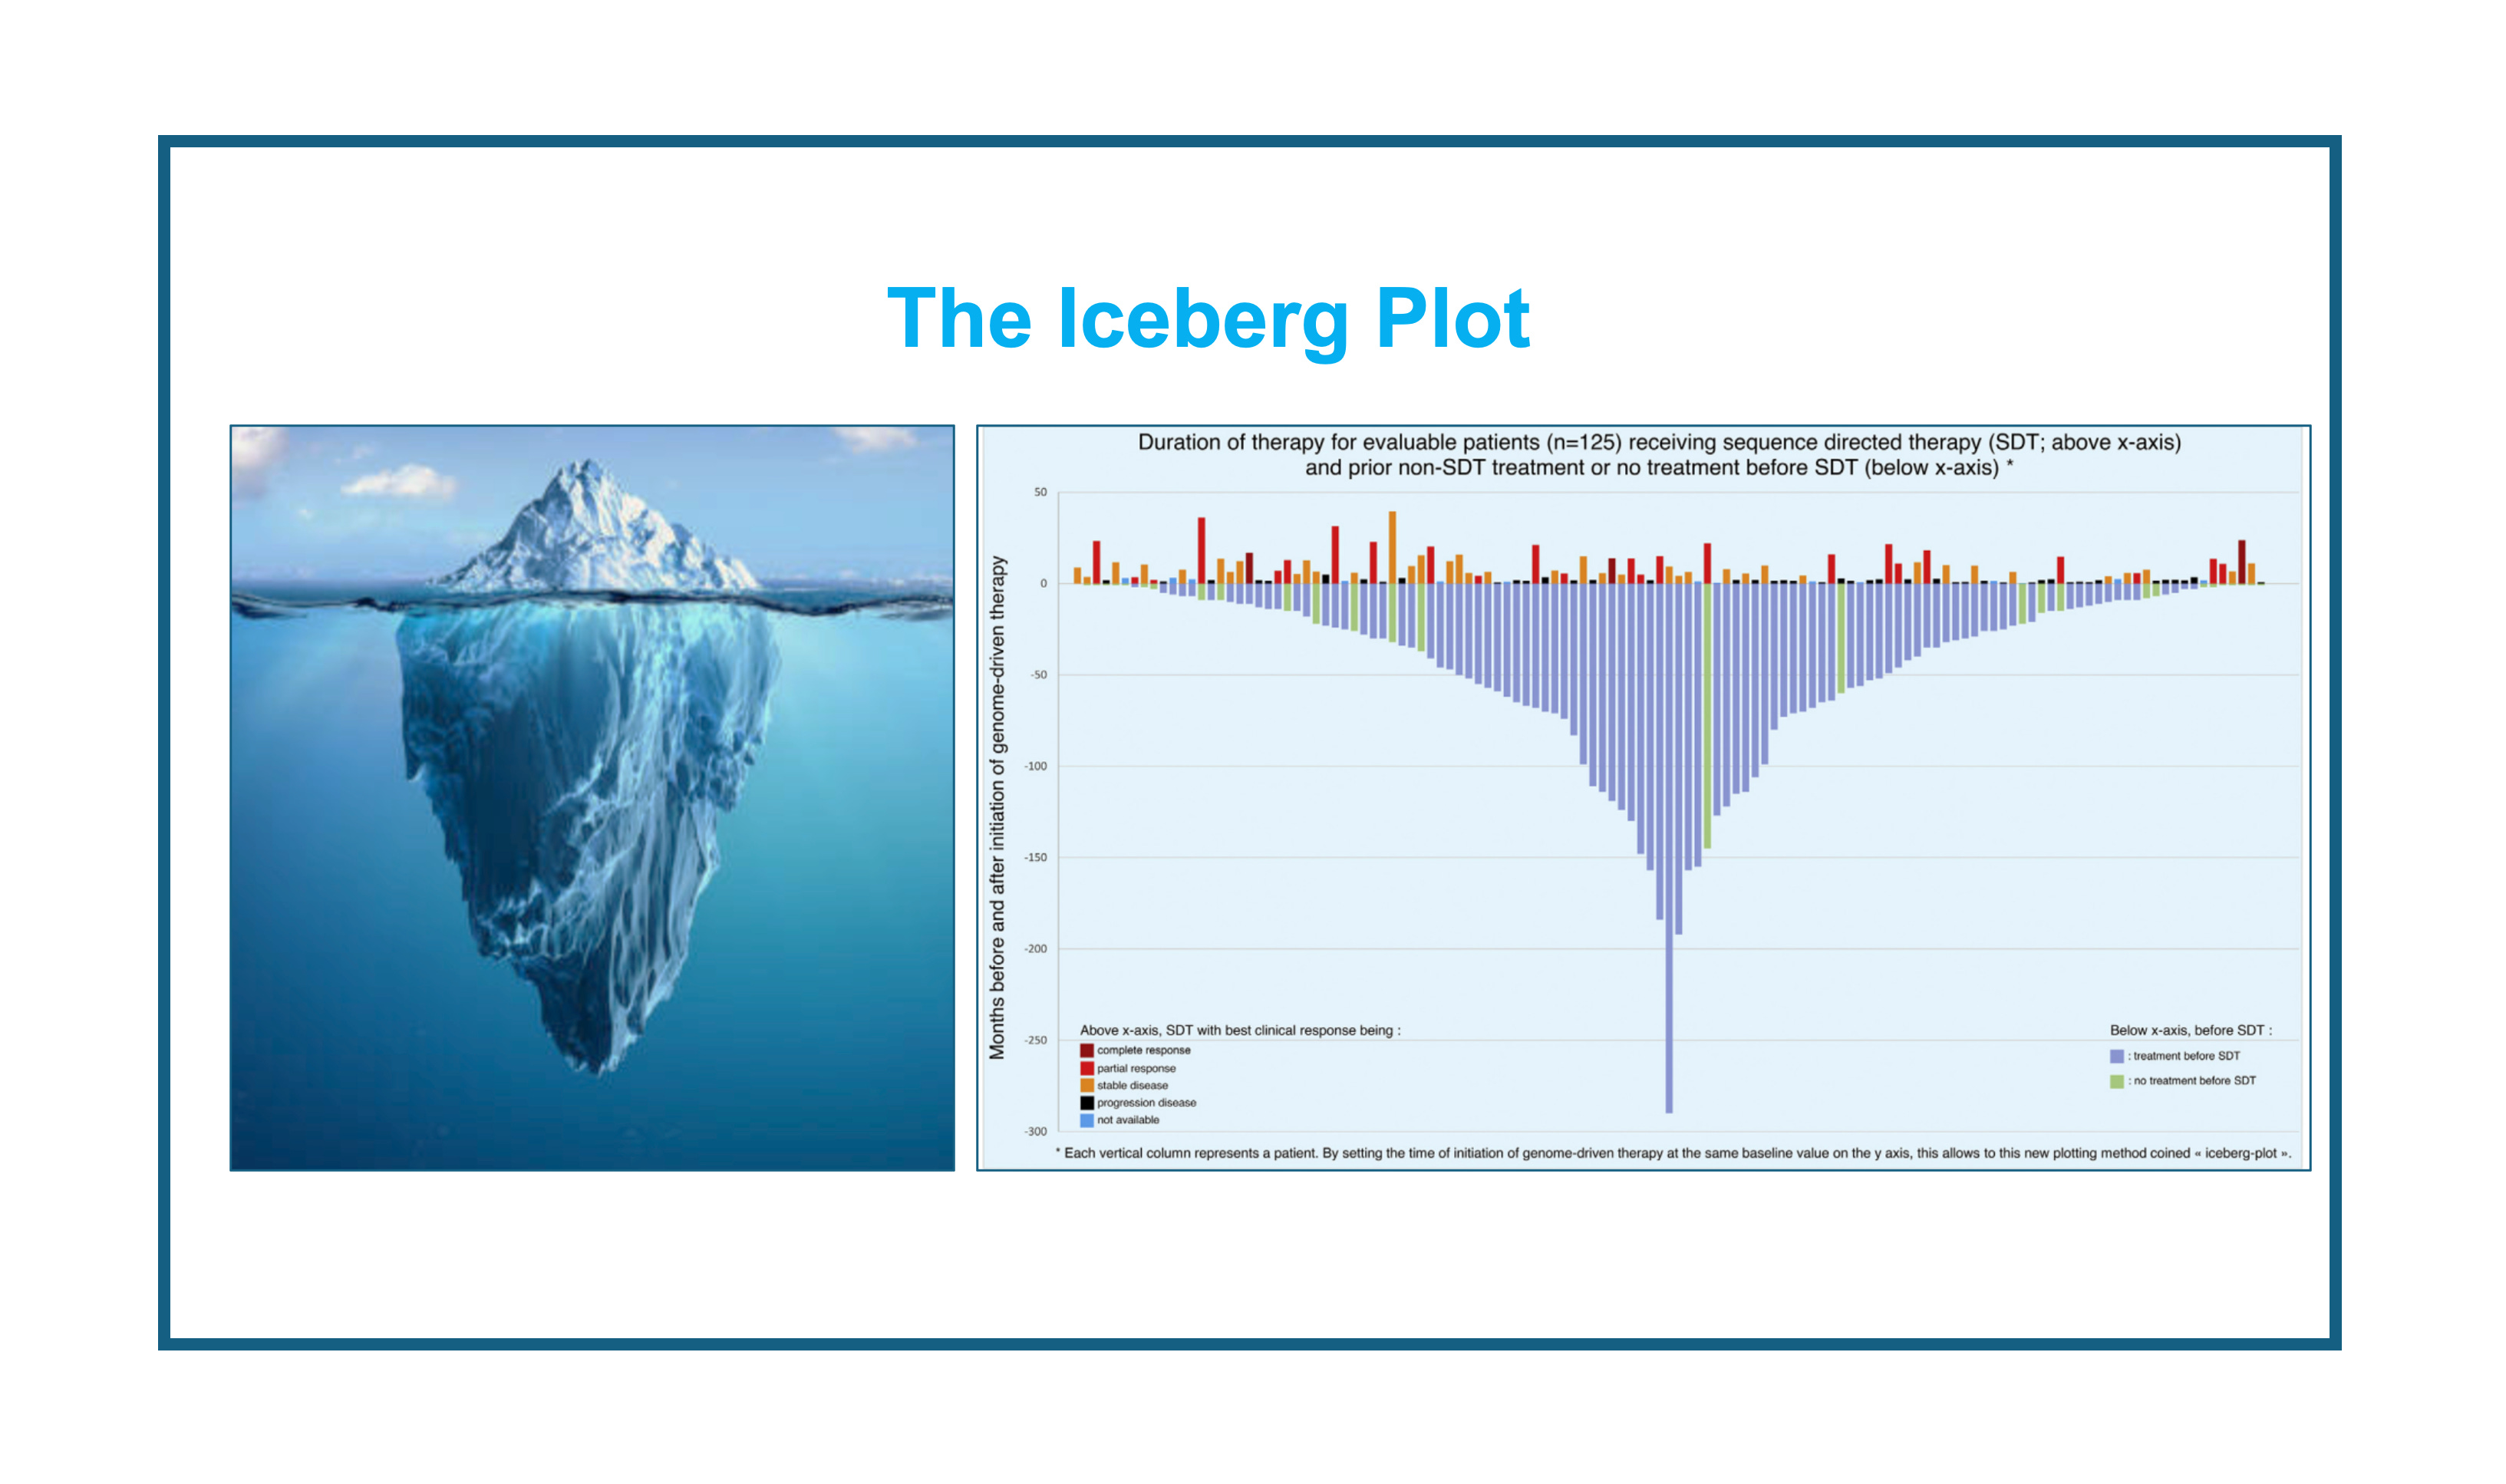
One way to distinguish between these possibilities is to compare, for the same patients, their outcomes before and after the therapy. This is the core idea behind the Iceberg Plot, which was designed and published in The European Journal of Cancer soon after I joined the VKPrasad Lab.
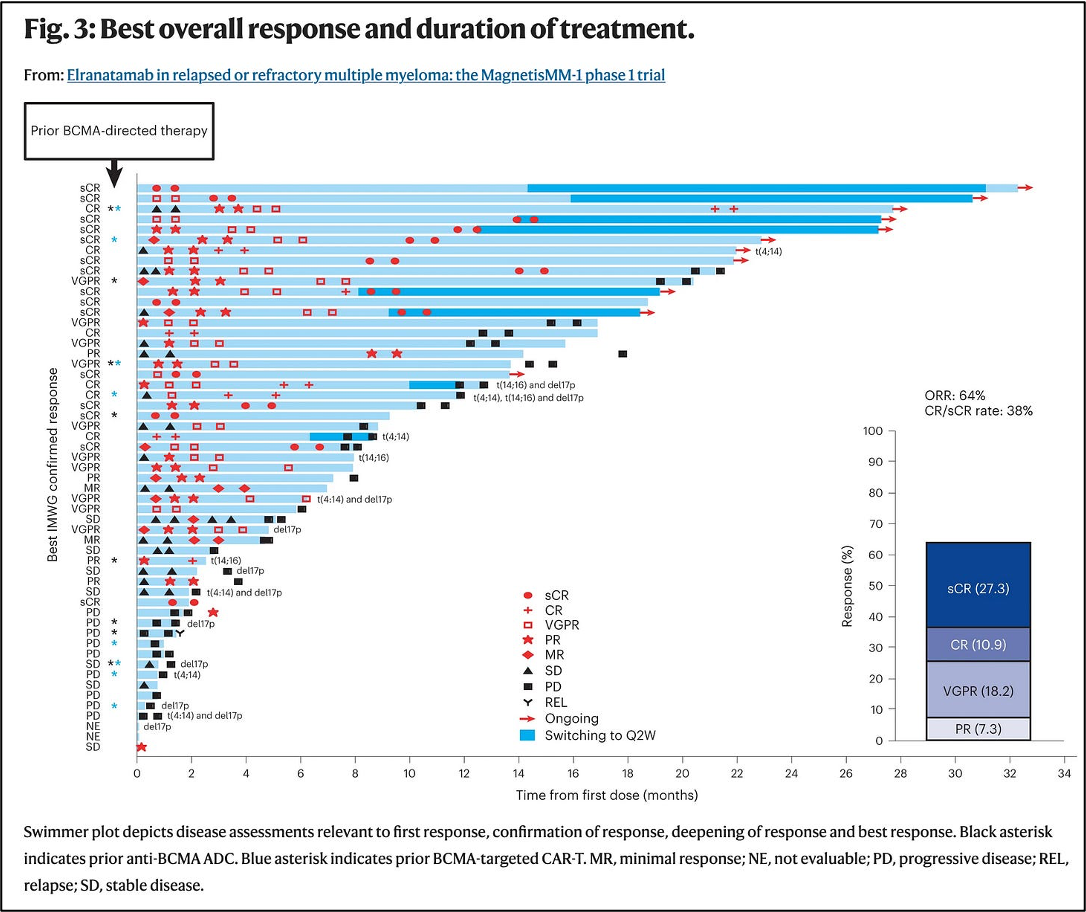
The swimmer plot - no prior therapy data
In Swimmer plots, as the one below (from this publication), you have no data on prior therapy. Each patient has a “lane”, and the lane is beginning with the novel therapy.
Comparing new therapy data to prior therapy.
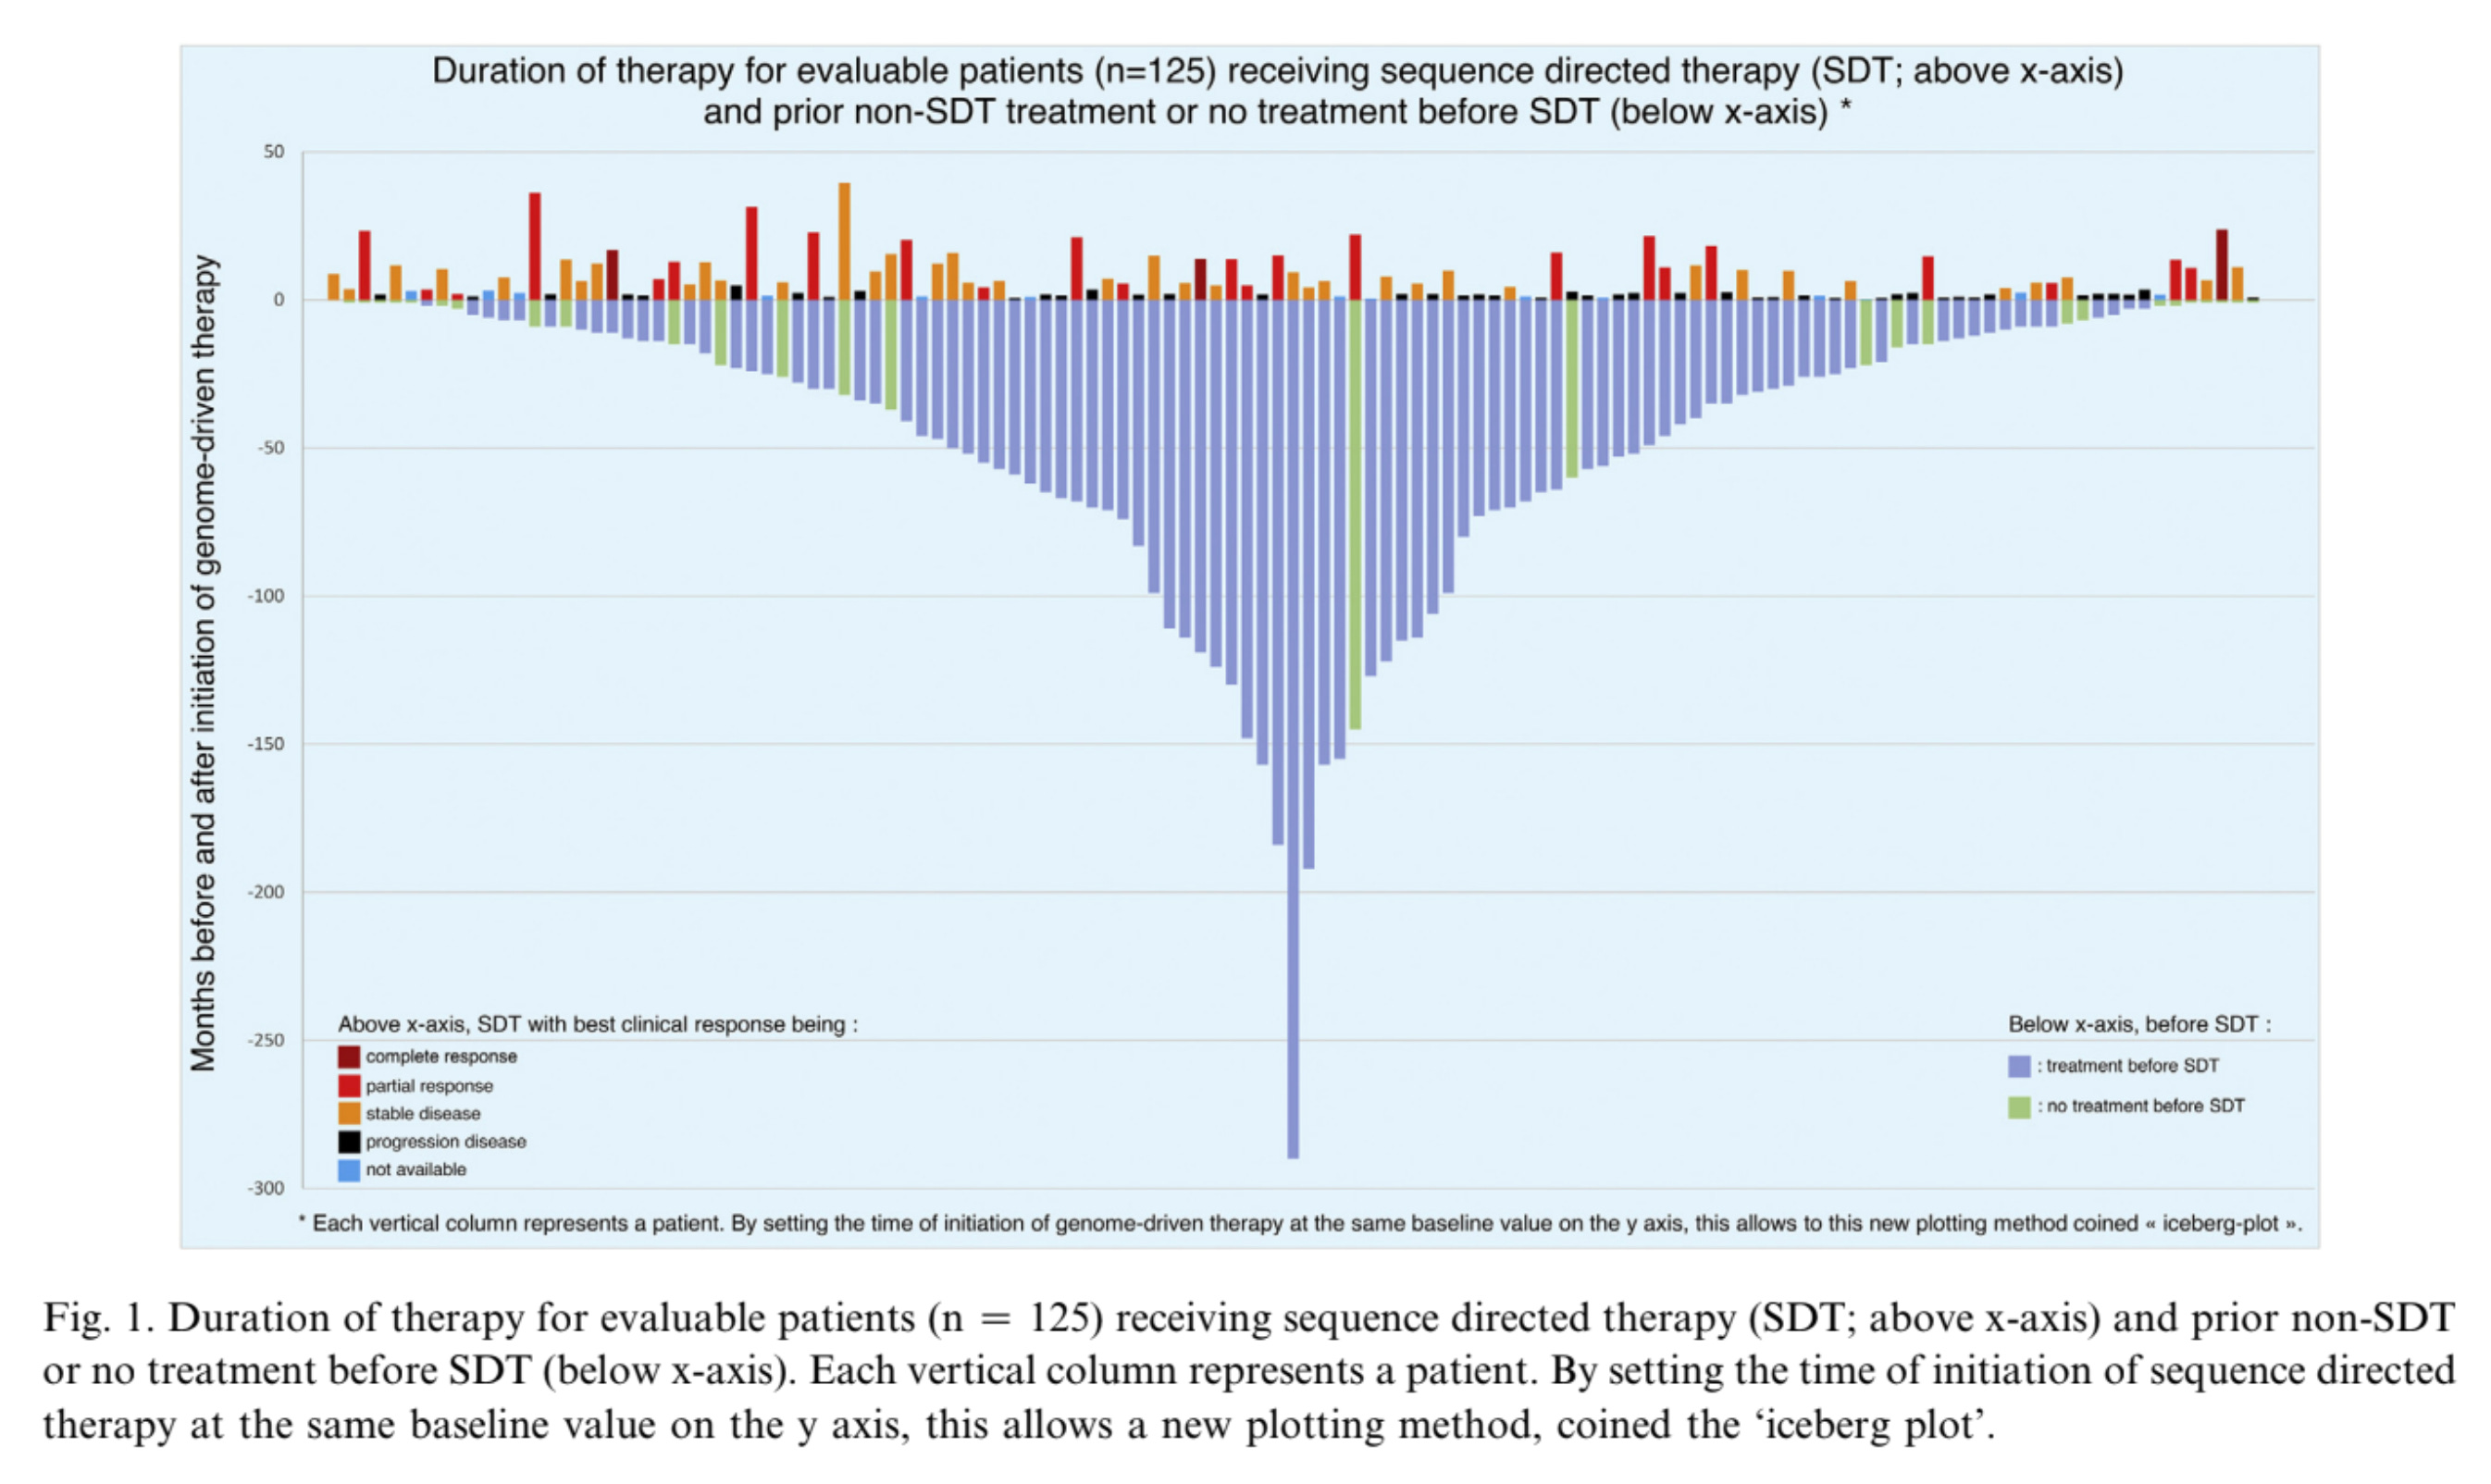
We reanalyzed data from a JAMA Oncology report of a cohort study involving 1138 patients with advanced solid tumors. Next-generation sequencing (NGS) was successfully performed in 1015 patients (89.2%), identifying potentially actionable alterations in 817 (80.5%). Among these, 132 patients (16.2%) received sequencing-directed therapy (SDT), of whom 49 (37.1%) experienced clinical benefit and 26 (19.7%) achieved responses lasting 12 months or longer.
Notably, the study reported prior therapy data for 125 of the 132 patients treated with SDT, enabling the construction of the Iceberg Plot. In this plot, the new therapy (here, SDT) appears above the ocean line, while the time prior to it represents the “invisible” part of the iceberg.
This visualization immediately contextualizes the results, offering a clearer understanding of treatment responses in relation to patients’ prior therapies.
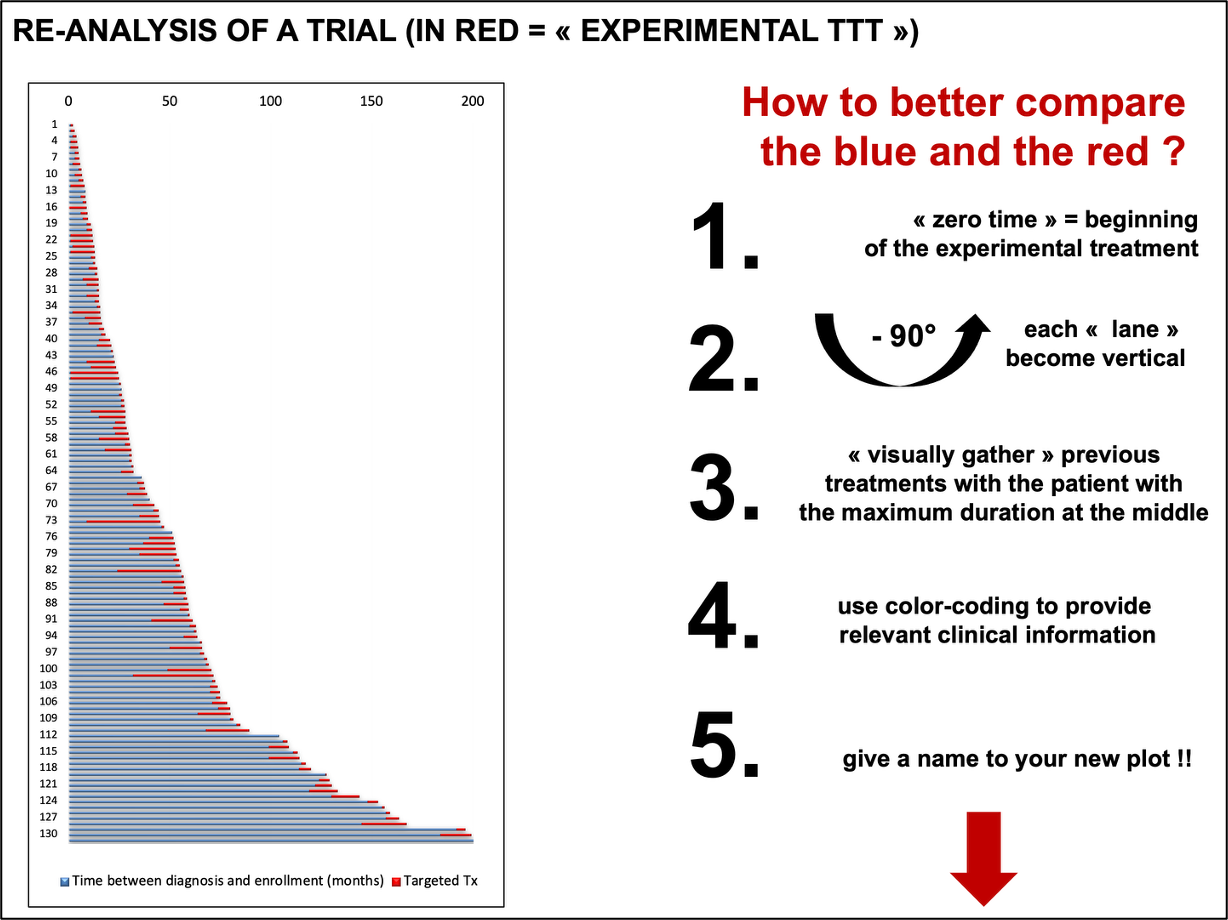
Below are two figures summarizing the steps required to transform a classical Swimmer Plot (shown on the left in the first figure) into the final Iceberg Plot (second figure).
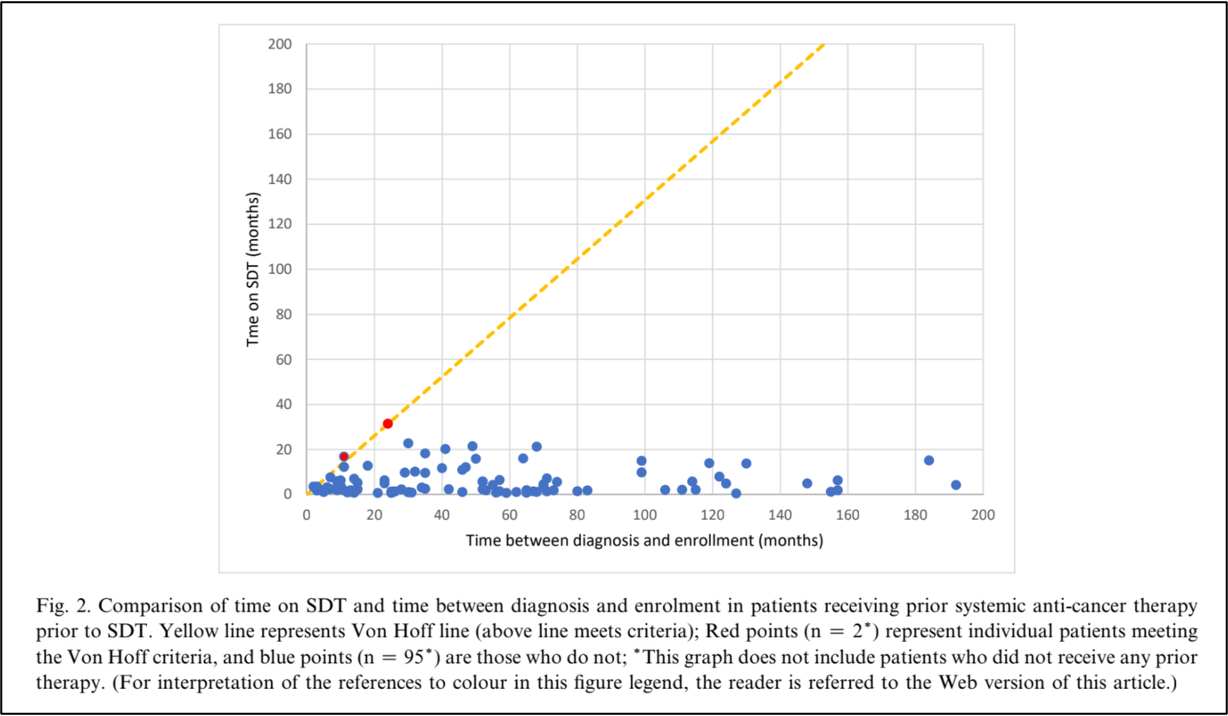
Von Hoff criteria and growth kinetics.
The central question is not only whether the tumor grows, but whether it grows faster or slower under a given therapy — in other words, this concerns tumor growth kinetics.
In this re-analysis, we also assessed how many patients met the Von Hoff criteria, a metric proposed by Daniel D. Von Hoff and colleagues. According to this criterion, a patient is considered to derive clinical benefit if the progression-free survival (PFS) on the new therapy is at least 1.3 times longer than the PFS on the prior therapy. In the analyzed cohort, the proportion of patients meeting this criterion was remarkably low, with only 2 of 97 patients (represented by the red points in the figure below) satisfying it.
Key point
When interpreting outcomes such as PFS or other composite measures that include stable disease (like the disease control rate – DCR) from uncontrolled data, one should always consider whether the observed outcomes reflect a rather indolent tumour biology or are related to the therapy itself.
In such cases, assessing growth kinetics—for instance, by comparing outcomes with the prior line of therapy—can be informative.
Instead of Swimmer Plots, Iceberg Plots should be more widely used in oncology trial reports. (full paper here)
From the top of my head, I can't think of any treatment in uro-oncology that would meet the Von Hoff criterion, except maybe ARPI after docetaxel in metastatic prostate cancer.
Wouldn’t it be better to use last PFS before experimental therapy on the submerged part of the iceberg ( instead of time from diagnosis to experimental therapy) ? If the disease was indolent for many years but then took off with rapid recurrences etc ; the immediate prior PFS should be a good predictor of normal expectations on standard of care